
Maximizing GIS Potential for Enhanced Hazard and Risk Management During Natural Disasters
- VanguardGeo Team

- Jan 28
- 3 min read
Natural disasters strike with little warning and can cause devastating damage to communities, infrastructure, and the environment. Managing hazards and risks effectively requires timely, accurate information and coordinated response efforts. Geographic Information Systems (GIS) have become essential tools in this field, offering powerful ways to collect, analyze, and visualize spatial data related to natural disasters. This post explores how GIS can improve hazard and risk management, providing practical examples and insights for emergency planners, responders, and policymakers.
Understanding GIS in Natural Disaster Management
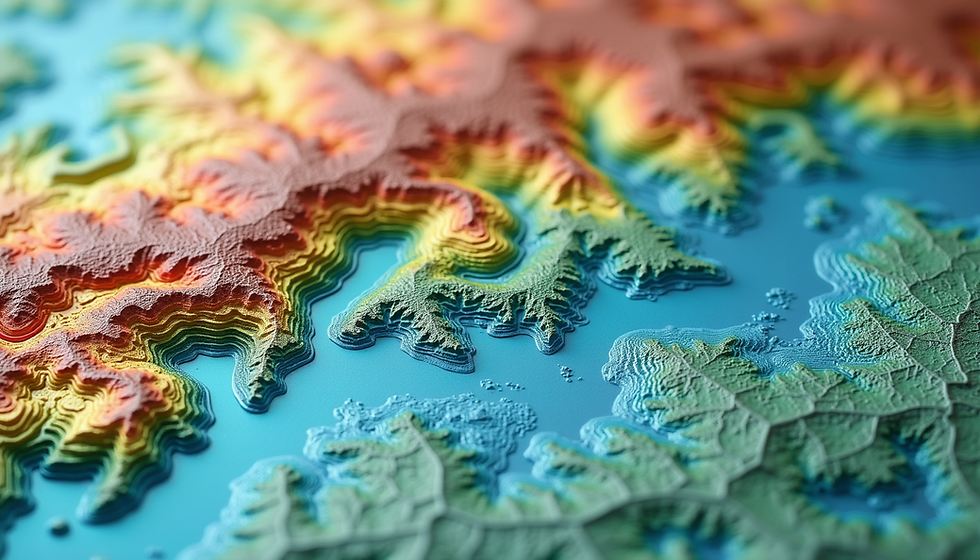
GIS is a technology that captures, stores, analyzes, and presents geographic data. In the context of natural disasters, GIS helps identify hazard-prone areas, assess vulnerabilities, and plan mitigation strategies. It integrates various data sources such as satellite imagery, weather data, topography, and infrastructure maps to create a comprehensive picture of risk.
GIS supports all phases of disaster management:
Preparedness: Mapping hazard zones and vulnerable populations to plan evacuation routes and resource allocation.
Response: Real-time tracking of disaster impact, damage assessment, and coordination of emergency services.
Recovery: Monitoring rebuilding efforts and environmental restoration.
Mitigation: Identifying areas for infrastructure improvements and risk reduction measures.
Mapping Hazards and Vulnerabilities
One of the primary uses of GIS is to map natural hazards such as floods, earthquakes, wildfires, and hurricanes. By layering hazard data with demographic and infrastructure information, GIS reveals which communities and assets face the greatest risk.
For example, in flood-prone regions, GIS can combine rainfall forecasts, river levels, and land elevation data to predict flood extent. Emergency managers use these maps to:
Identify neighborhoods at risk of inundation.
Locate critical facilities like hospitals and shelters.
Plan evacuation routes that avoid flooded roads.
In earthquake-prone areas, GIS integrates seismic activity data with building codes and soil types to assess structural vulnerabilities. This information guides retrofitting efforts and emergency planning.
Real-Time Data Integration for Faster Response
During a disaster, conditions change rapidly. GIS platforms can ingest real-time data from sensors, drones, and social media to provide up-to-date situational awareness. For instance:
Satellite images can show wildfire spread and hotspots.
Weather radar feeds track storm paths and intensity.
Crowd-sourced reports help identify blocked roads or damaged infrastructure.
Emergency operations centers use GIS dashboards to monitor these inputs, enabling faster decision-making and resource deployment. This dynamic mapping reduces response times and improves coordination among agencies.
Case Study: Using GIS in Hurricane Response
Hurricane Katrina in 2005 highlighted the need for better hazard and risk management tools. Since then, GIS has played a critical role in hurricane preparedness and response.
Before a hurricane, GIS models simulate storm surge and wind damage to identify evacuation zones. During the event, GIS tracks the storm’s movement and flooding in real time. Afterward, damage assessments using aerial imagery and field data help prioritize rescue and recovery efforts.
For example, the Federal Emergency Management Agency (FEMA) uses GIS to manage disaster declarations, allocate funds, and plan rebuilding projects. This approach has improved response efficiency and helped reduce losses in subsequent hurricanes.

Enhancing Community Resilience with GIS
GIS also supports long-term resilience by informing land use planning and infrastructure development. Planners can use hazard maps to avoid building in high-risk zones or design flood defenses and firebreaks. Public education campaigns benefit from clear visualizations that communicate risks to residents.
Communities can participate in GIS-based risk mapping through participatory approaches. Local knowledge combined with GIS data creates more accurate and accepted hazard maps. This involvement fosters trust and encourages proactive risk reduction behaviors.
Challenges and Considerations
While GIS offers many benefits, some challenges remain:
Data quality and availability: Accurate hazard and vulnerability data may be limited, especially in remote or developing regions.
Technical expertise: Effective GIS use requires trained personnel and resources.
Interoperability: Different agencies may use incompatible systems, hindering data sharing.
Privacy concerns: Collecting detailed location data must respect privacy and ethical standards.
Addressing these issues involves investing in data collection, training, and collaboration frameworks.
Practical Tips for Implementing GIS in Disaster Management
Organizations looking to maximize GIS potential should consider:
Establishing partnerships with local governments, universities, and tech providers to access diverse data sources.
Using open-source GIS software to reduce costs and increase flexibility.
Training staff in GIS tools and spatial analysis techniques.
Developing standardized data formats and protocols for easy sharing.
Incorporating community input to improve data relevance and acceptance.
The Future of GIS in Hazard and Risk Management
Advances in technology promise to expand GIS capabilities further. Artificial intelligence can enhance hazard prediction models. Drones and satellites will provide higher-resolution and more frequent data. Mobile GIS apps will empower field responders and citizens alike.
Integrating GIS with other systems such as early warning networks and emergency communication platforms will create more connected and effective disaster management ecosystems.
By embracing these developments, communities can better prepare for, respond to, and recover from natural disasters.


Comments